
Version Control in BI Dashboard tools: How many times have you just shared access to a new dashboard with your boss and just when your boss is having their first look, a team member just happens to be making an esthetic change…We have all been there!
Nowadays the use of Business Intelligence tools are being more widely employed as data driven companies make these tools available for self-service analytics by business units. This is empowering more analysts to publish dashboards and driving more rapid publication cycles to executives and decision makers.
The BI tools vary in their capabilities and strengths but one functional area that most fail to offer adequate coverage is in a software version control capability.
At Making Science we have numerous customers using Data Studio, Looker, MicroStrategy, PowerBi and Tableau. In today’s BLOG we will do a comparative analysis of DataStudio, Looker and PowerBi regarding their software version control capabilities.
What is software version control?
Taking a look at the definition in Wikipedia:
“In software engineering, version control (also known as revision control, source control, or source code management) is a class of systems responsible for managing changes to computer programs, documents, large web sites, or other collections of information. Version control is a component of software configuration management.[1] Wikipedia Version control definition. At Making Science we apply methodology to ensure that version control is applied to software, sql, data definitions, views, reports and dashboards.
The software version control functionality allows dashboard developers/analysts to work on new versions without disrupting the stability of dashboards currently in use by business executives/users. Additionally the software version control allows multiple developers/analysts to work on the same dashboard at the same time without stepping on the changes of each other’s work, and when ready merging the changes of the work done into a new version of the dashboard.
As dashboards and underlying data metrics and KPI calculations will continue to evolve at a more rapid pace with the incorporation of more technical talent publishing the necessity of strong version control becomes critical to the business to maintain a well functioning data driven business.
In the following paragraphs we will take a brief look at some of the dashboarding tools in use by many Making Science analysts working with our customers.
Version control in Power BI and Data Studio
Microsoft’s PowerBI is extremely rich in capabilities to create feature rich dashboards including dashboards that can accept streaming data sources allowing real-time visualization. Additionally PowerBI has a Desktop component allowing report/dashboard developers to create new versions without impacting business users until they PUBLISH their report/dashboard. Unfortunately PowerBI doesn’t have an integrated version control system for the PowerBI objects (reports/dashboards) that are created. The lack of the version control complicates the effort and activities of dashboard developers. The best work around is to
- Ensuring that each report/dashboard has a label to indicate the version number of the report and that the version number is updated.
- Export and save the report/dashboard manually, giving it a version number.
- Saving the object new version into any Git repository, such as GitHub, Bitbucket…
- Publishing the revised report/dashboard.
These steps can be slow, tedious and prone to errors since it is not automatic. Additionally, this work around does not offer a transparent means to ensure visibility on the version of software being worked on in PowerBI desktop nor does the end user have visibility of a newly published version of a dashboard.
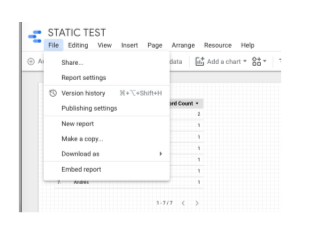
Google’s DataStudio is known as one of the easiest BI tools to work with in the market. DataStudio version control system, called Version History and Publishing.
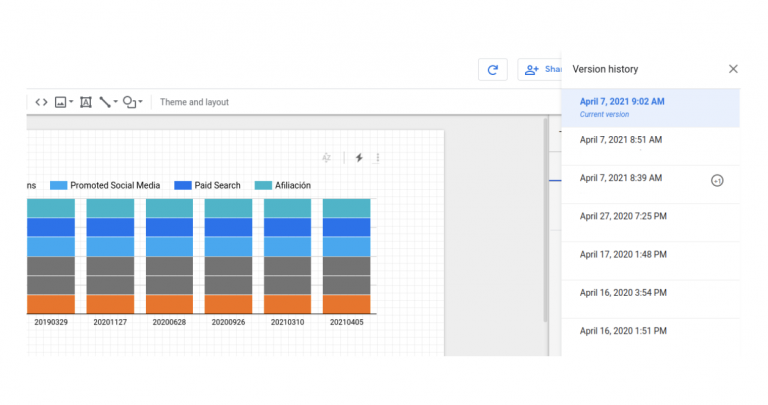
The version history allows us to see the modifications that the dashboard has undergone, who has made the modifications, and revert to a prior version as in case it is needed.
The Publishing allows a dashboard developer to take an active action to publish the dashboard to their user community. The first step is to activate the publishing button.
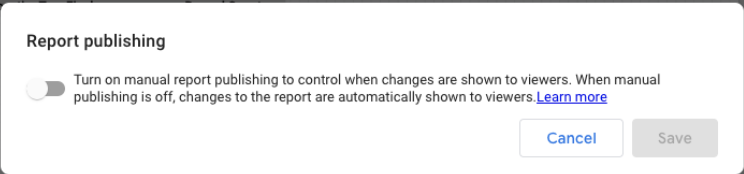
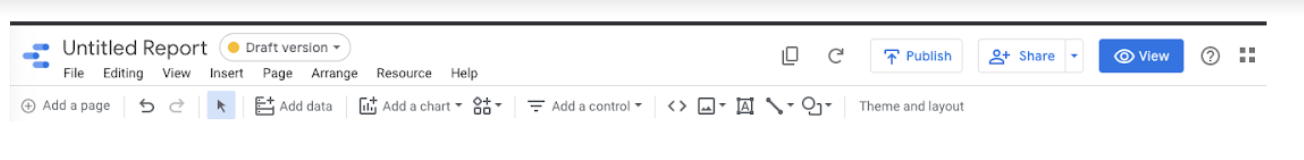
Once the Publishing option is enabled the developer will see a status indicator of (yellow bullet) Draft version when the Dashboard is under editing or (green bullet) Published when already published to the user community. Lastly the developer has a publish button to make the dashboard available to users, the dashboard is not visible by the users until the publish button is clicked.
Google’s Looker
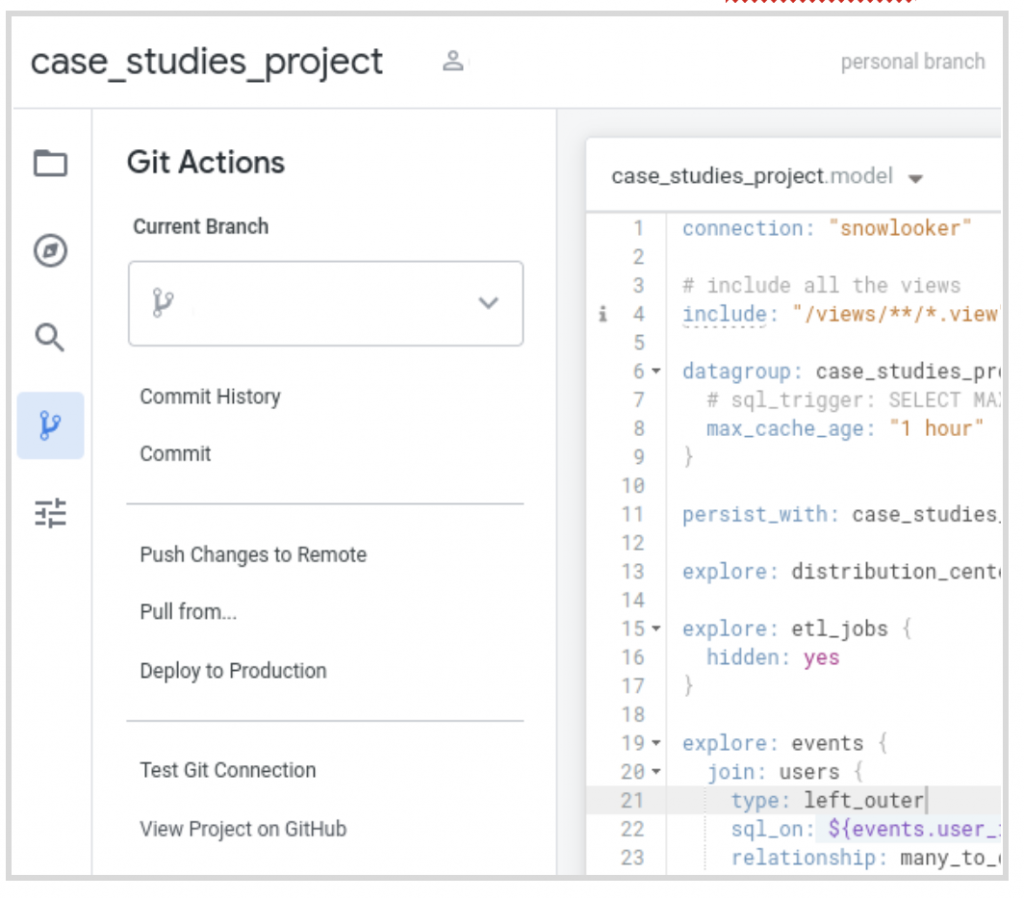
Looker goes beyond the traditional BI tools and offers extensive functionality in the area of data governance. Additionally Looker delivers a welcomed surprise for those that come from a software development background in the area of version control. Looker has a version control system fully integrated with GIT, one of the most widely used version control systems.
So for each project we have in Looker we can assign an online GIT repository to be able to save the changes as we are working in new LookML and dashboard versions. The GIT functionalities are available directly from the Looker interface, which helps people who are not yet familiar with the GIT tool to simplify its use.
For example, changing the branch we are working on, branches in GIT would be a copy of any version of the project to be able to work on a new feature without affecting the production one, checking the list of modifications we have made. And once we are satisfied with the result, we can merge the results from other team members if desired and we can publish a newly tagged version into production.
An additional benefit of this GIT integration in Looker is we can also install new plug-ins into our Looker platform offering the team new dashboarding capabilties. All we need is the link to the GIT repository where the plug-in is stored. Once the plug-in is installed we can use new visualization graphs to create better dashboards in any of our projects.
Conclusion
As you can see, using version control systems and controlled publishing has many advantages when it comes to managing the perceived stability of your reporting/dashboard projects. The benefits can also be seen in:
- Better teamwork
- More autonomy for developers
- Faster problem diagnosis and tracking bugs
- Ease of continuous deployment
- Access to a world of opensource extensions


 Cookies configuration