
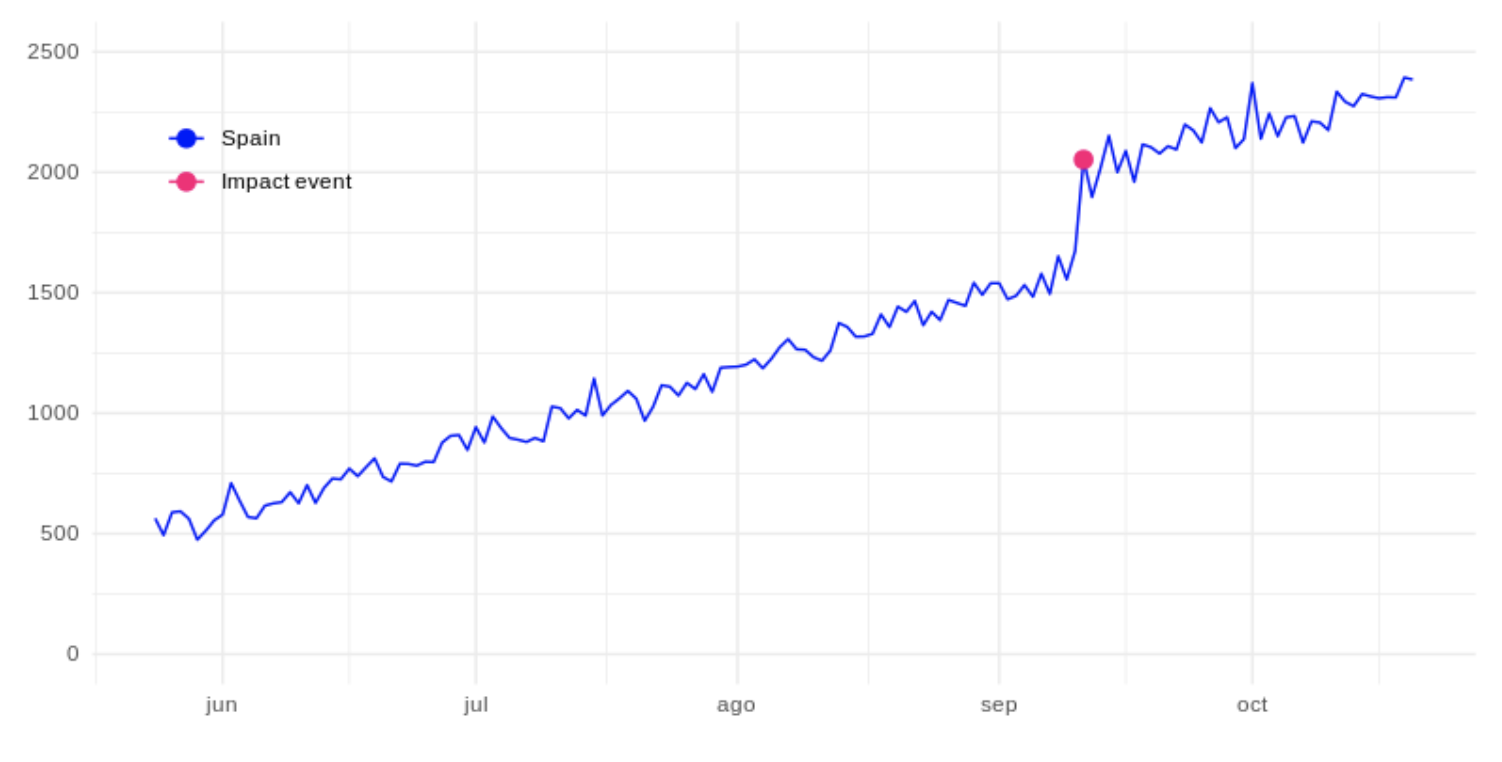
 The fuchsia dot represents the number of unique visitors on the day that, for example, a certain marketing campaign started, which we will refer to as an impact event. Suppose we have our same website in other countries such as Italy and Portugal (control groups), where the impact event has not occurred:
 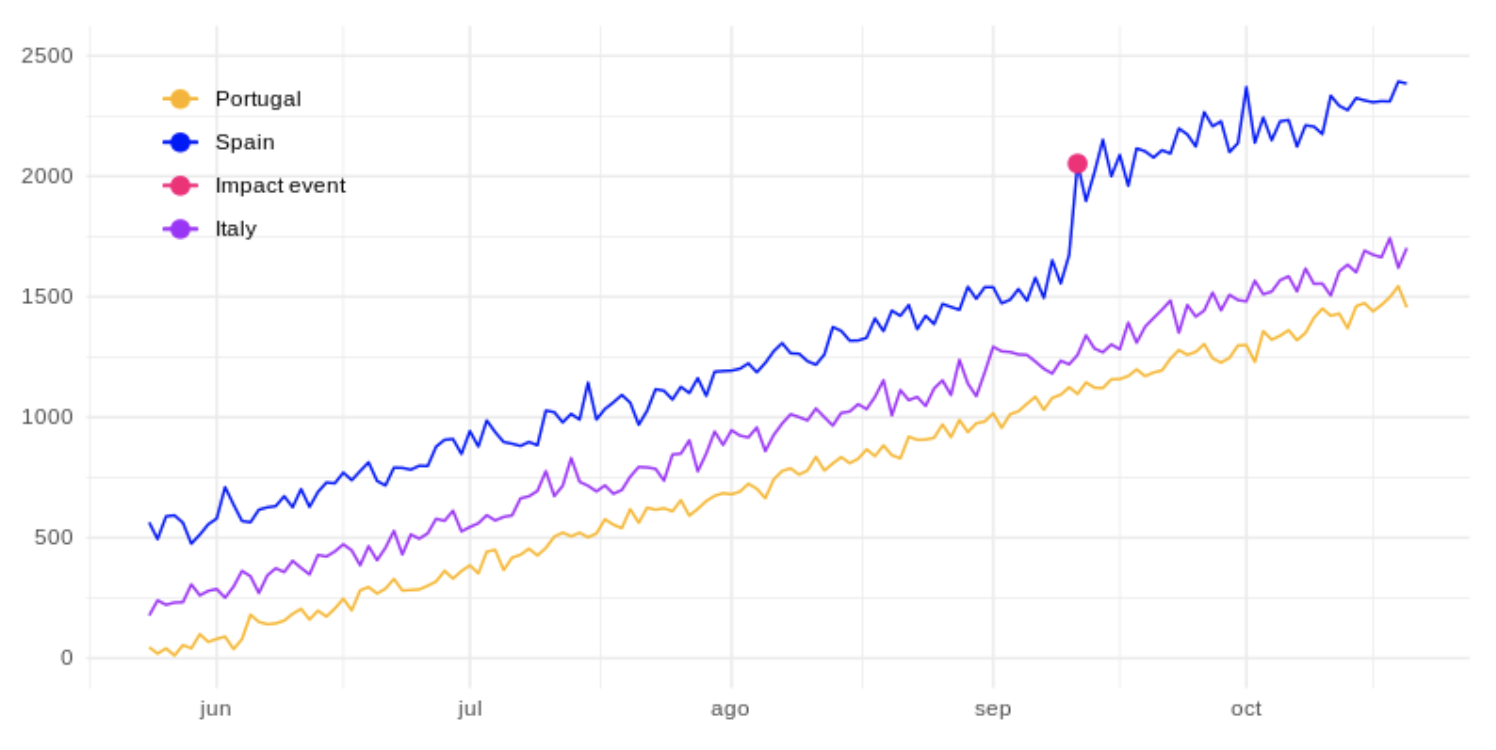 With the Causal Impact algorithm we could create a model based on the data of unique visitors from these countries to project the expected values in the same period of time in Spain. Acting as a base series and indicating the number of unique visitors that we would have expected in Spain, in case the campaign had not been carried out. Shown as the purple line below:
 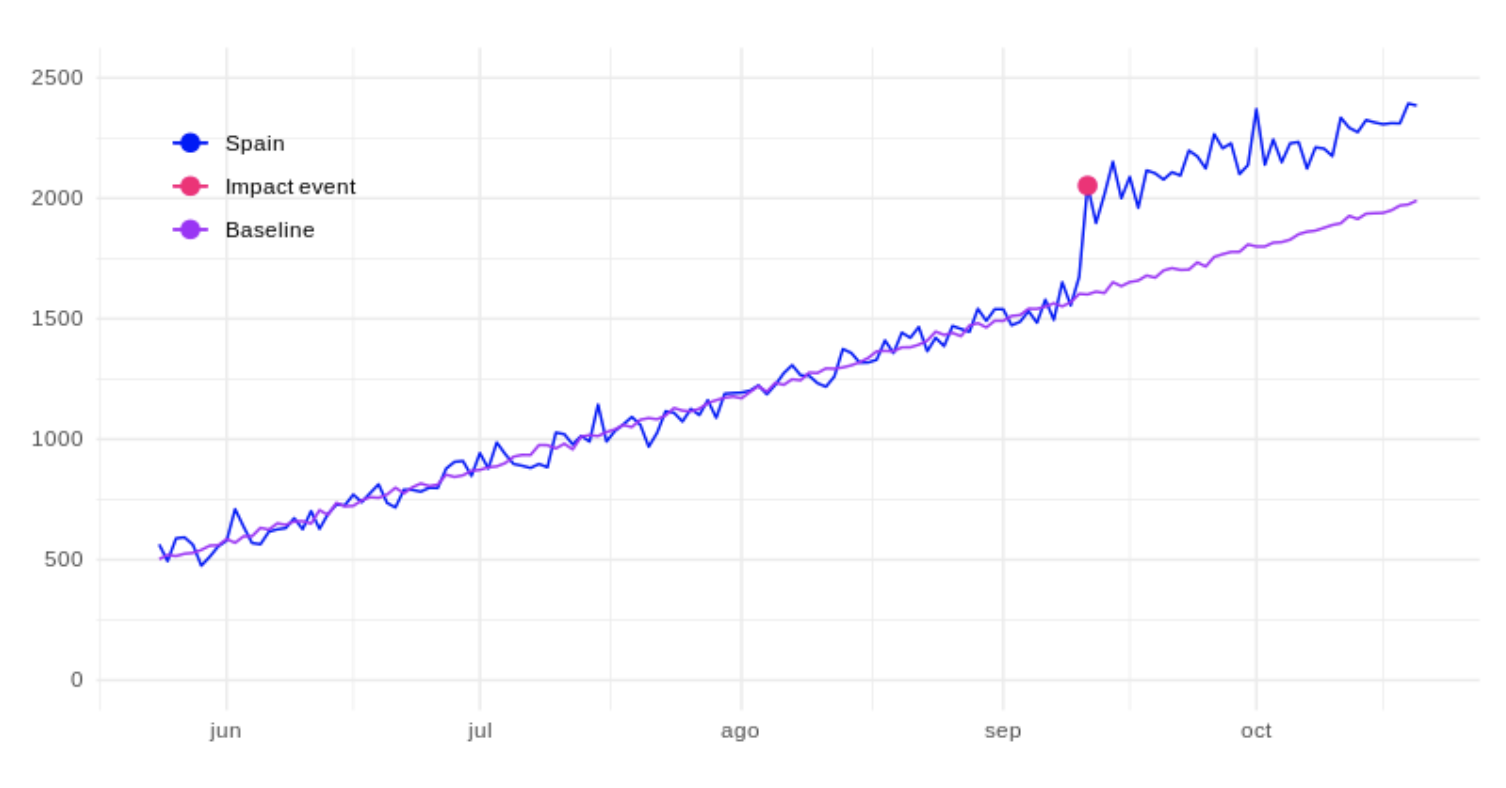 Once we obtain this base series, we can calculate the differences between the two time series, the real values for Spain and the estimated values if the impact event had not occurred. And so, consider the difference as the real impact of the event, as represented by the purple line in the following figure:
 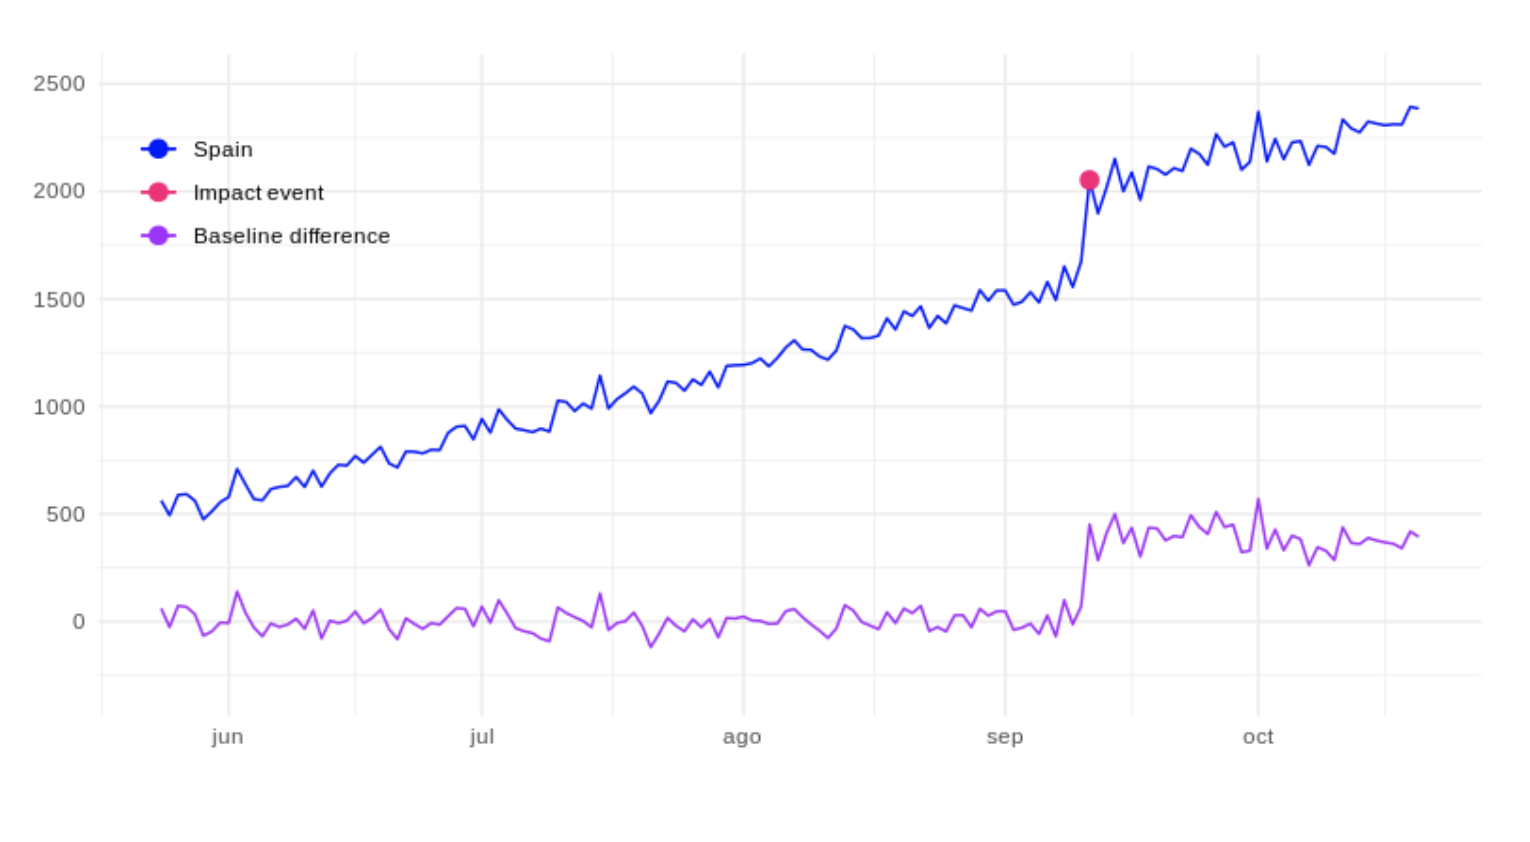 Or on the other hand, accumulate the series to be able to see the total impact up to any given date. The fuchsia line below represents this:
 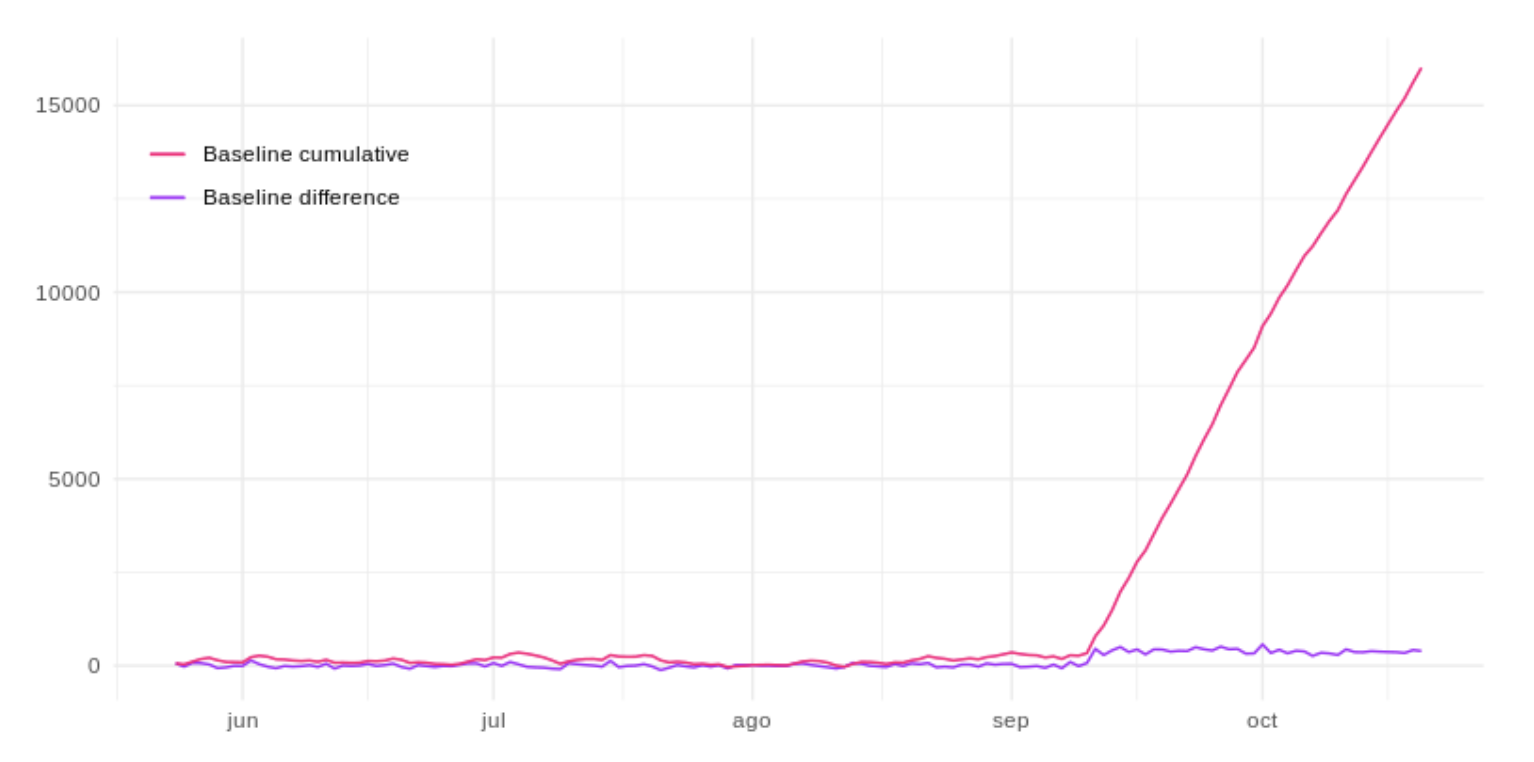 In this way, we can measure the ROI (return on investment) of said campaign in a much more fair way, even when we are not sure if the event was the only source of impact. The Causal Impact algorithm helps to obtain this information quickly so that you can adjust any action in a timely manner with confidence.
The Causal Impact algorithm
The main idea of the algorithm is to construct a Bayesian time series based on multiple control groups (in the previous example, Italy and Portugal), and to adjust for differences in size between the control groups and the test group (Spain) to obtain a synthetic base series. Control groups are those in which we did not have the impact event. Therefore, no changes in the series produced by this event are expected. The test group is the one where the impact event occurred, and we hope that this has produced some change in the time series.
What is the synthetic base series?
Basically, it is a series of values that we would have expected in the test group without the impact event. Unlike other algorithms based on time series, where the predictions are made with the past values of the test group, this algorithm builds the model through the control groups for a time after the impact event. This means that the control groups, or the combination between them, must have correlation with the test group for the algorithm to make confidence predictions.
How to choose correlated control groups?
The Causal Impact algorithm automatically selects the most correlated control group or groups using the Bayesian technique of selection of spike-and-slab variables. But the technique proposed by Kim Larsen complements the Causal Impact algorithm to obtain the most correlated groups. This technique is known as Dynamic time warping (DTW).
DTW
Obtaining the correlation without more, between two time series, ignores a phenomenon that usually occurs in the series, which is the temporal displacement: 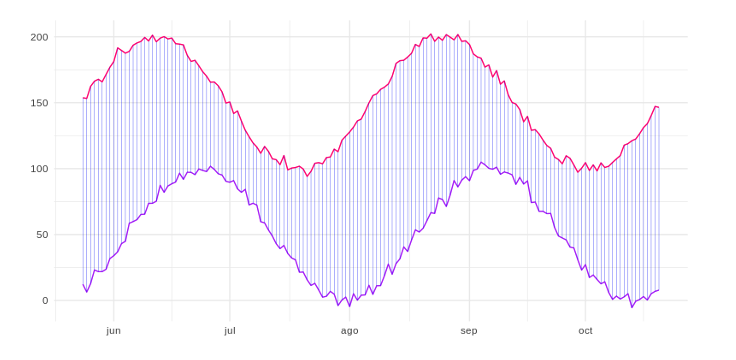 The two previous series do not have the modes positioned at the same moment, but just by observing them you can see that there is a high “correlation” between them. The highs and lows of the purple line come a little later than those of the fuchsia line. Therefore, calculating the distances one by one along the time axis would ignore the offset and could label these two series as different rather than similar. The DTW technique allows one-to-many mapping to be carried out, calculating the distances of one time series with respect to another, taking into account the possible temporal displacements that could exist between the two (cross correlation). As shown in the following figure:
 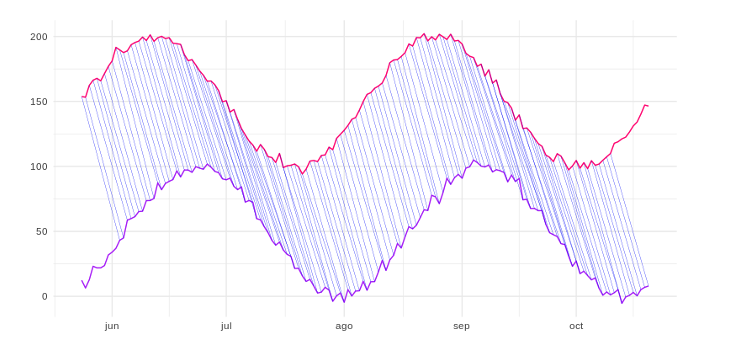 By using this algorithm we can calculate the distance between these two lines even if there is a time shift, and therefore we can consider that they are more similar or “correlated” than they could have been without it. Other cases that DTW corrects is to determine that there is a correlation between two series, even if one is contracted or dilated with respect to the other. We can basically use the DTW algorithm to find the control groups most similar to the test group and pass them to the Causal Impact algorithm as predictors, and then let the algorithm do its work!


 Cookies configuration